We sell a media-buying tool that starts at $500. If we expect brands to trust a $500 test, the first one worth running is our own. It was partly proof and mostly practice: we wanted to know what a flight at this size teaches before telling anyone to run one. In late August we ran it for Fashion Wizard — $500.05, thirteen days, display and connected TV, planned in the Wizard like any customer would.
Campaign results below come from our DSP (Pontiac, campaign 14699). The raw numbers are the same ones a client sees.
$500.05 over thirteen days (Aug 19–31), evenly paced, no front-loading. Three lines:
| Line | Impressions | Spend | CPM |
|---|
| Display — geofence prospecting | 31,000 | $187.65 | $6.05 |
| CTV — fashion SMB audiences | 14,562 | $265.42 | $18.23 |
| Display — interest prospecting | 10,416 | $46.98 | $4.51 |
| Total | 55,978 | $500.05 | $8.93 |
CTV took 26% of impressions; display and mobile took the rest. That split was deliberate: enough CTV weight for completion to mean something, enough display volume to read a click-through rate.
$500.05 delivered 55,978 impressions at an $8.93 blended CPM: a 0.34% display click-through rate and 98.9% completion on CTV video. The delivery breakdown:
| Metric | This campaign |
|---|
| Impressions delivered | 55,978 |
| Blended CPM | $8.93 |
| Display CTR | 0.34% (141 clicks / 41,416 imps) |
| CTV completion | 98.9% (14,397 / 14,556 starts) |
| Reach | 200+ DMAs, 800+ publisher domains |
The pacing held even across all thirteen days: about $38 a day. That let us observe delivery throughout the flight instead of spending the full $500 in the first few days.
Our CTV inventory was non-skippable, so high completion is expected; it does not tell us whether viewers paid attention or intended to buy.
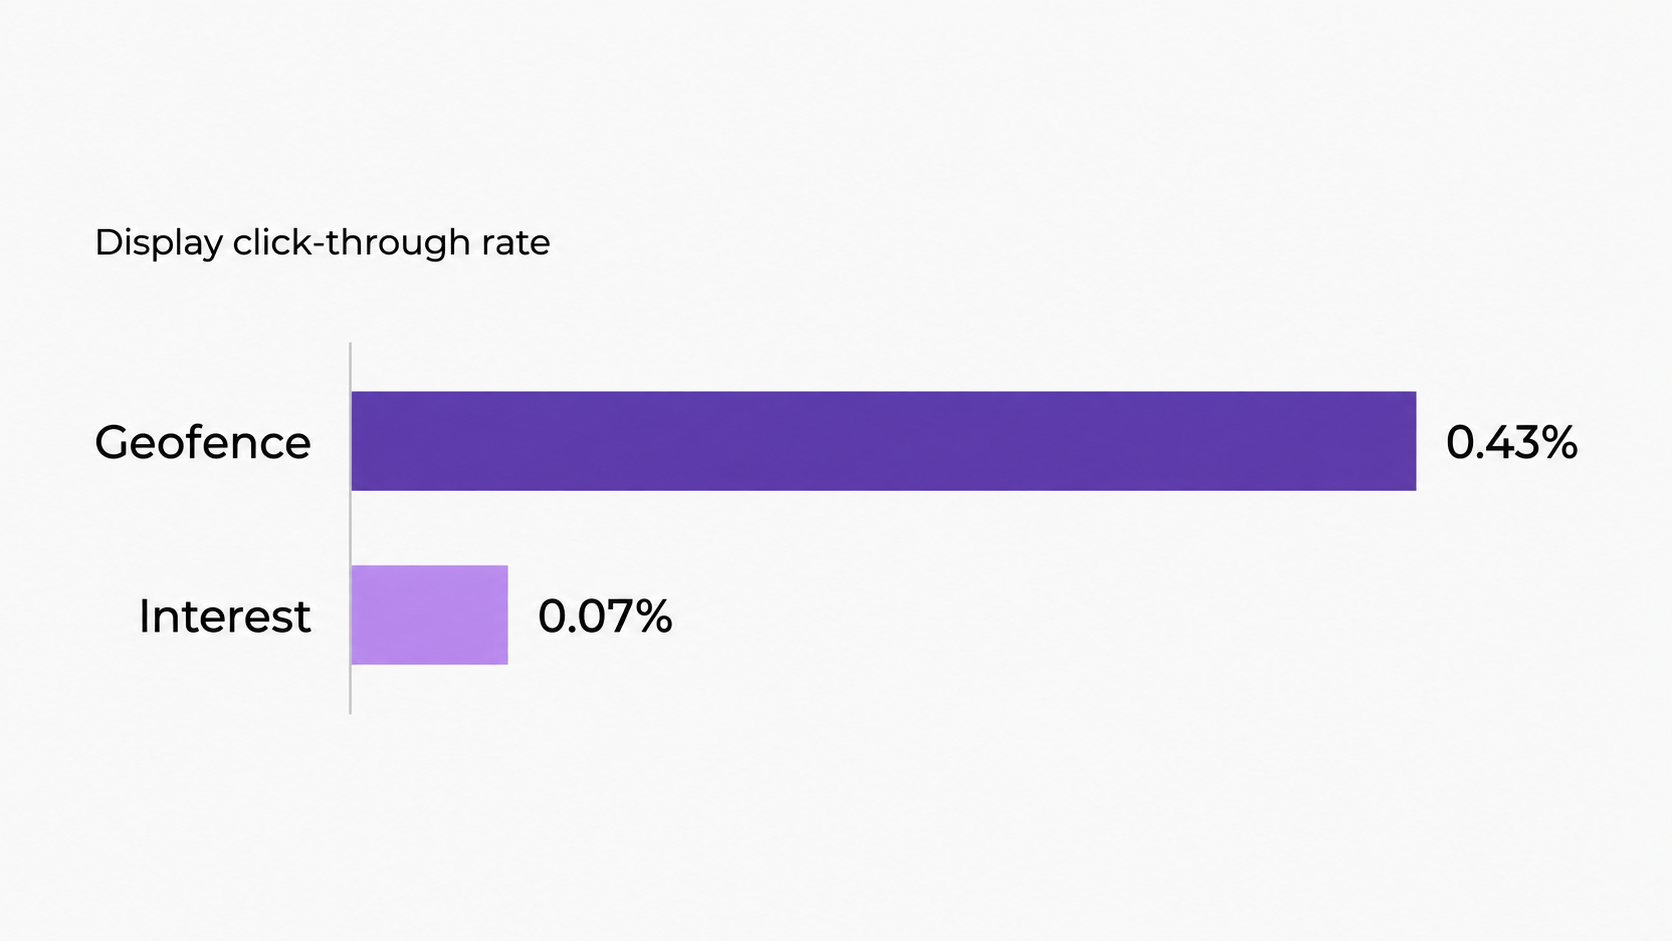
The two display lines ran side by side: same budget pool, same creative, same flight window. The geofenced line delivered 0.43% CTR and took 134 of the campaign's 141 clicks. The interest-targeted line delivered 0.07%, seven clicks across 10,416 impressions.
| Display line | Impressions | Clicks | CTR | Share of clicks |
|---|
| Geofence prospecting | 31,000 | 134 | 0.43% | 95% |
| Interest prospecting | 10,416 | 7 | 0.07% | 5% |
The publisher pool and creative were identical, which makes this a useful comparison within our own campaign. But shared settings do not guarantee the same mix of placements, devices, or creative sizes, and the lines received different amounts of spend. The geofenced line delivered roughly six times the CTR; this flight alone cannot tell us how much of that gap audience definition caused.
Our geofences focused on fashion industry hubs. Seven audiences were rolling: FIT New York, NYC Fashion Center Showrooms, Javits Center NYC, Chicago Merchandise Mart, Dallas Market Center, AmericasMart Atlanta, and LA Fashion District & Marts. The eighth was a static MAGIC Las Vegas audience with an August 10–12, 2026 collection window, before this flight began.
These were audiences built from location visits, rather than a requirement that ads appear inside those venues. We chose the hubs to reach people connected to the fashion business, because we were advertising a media-buying tool. A visit does not establish someone’s job or buying authority, but it gave us a more specific audience hypothesis than a broad fashion interest.
Our next budget decision: cut the interest line, move its budget into geofence prospecting, keep CTV's allocation untouched. If you're planning your own test, our guide to fashion and beauty audience segments covers what each segment costs; this flight gives us a reason to test industry hub audiences again.
Display impressions spread across more than 800 publisher domains. Mainstream news carried the volume (People alone took 27% of display impressions, with Yahoo, Page Six, and Fox News below it), and a long tail of lifestyle, fashion, and home titles took everything else.
The domain count is a floor, not a ceiling: our export is capped, so the ranked entries are complete but the tail runs longer.
Programmatic reach at $500 is real; you get genuine breadth rather than two premium sites. That breadth is mostly un-optimizable. The tail is useful for reach and too thin per-domain to draw conclusions from, so per-publisher optimization at test budgets amounts to optimizing noise.
Los Angeles (4,834 impressions) and Atlanta (3,312) led a top five — Chicago, Dallas–Fort Worth, and the Bay Area behind them — that carried 27% of impressions. Two hundred plus DMAs total.
CTV impressions largely report without a DMA, so this view is display-weighted. These are locations where ads were served across the campaign, not a map of visits used to build the geofence audiences.
The large formats looked excellent: interstitials at 2.53% CTR, skyscrapers at 1.28%. The volume tells a different story. The interstitial ran 395 impressions and the skyscraper 1,017. We treated formats with fewer than 2,000 impressions as exploratory, and the formats that actually carried delivery (the medium rectangle and the mobile banner, together most of our display volume) sat near 0.2–0.3%.
Moving budget toward the 2.53% alone would put too much weight on a small sample. The 2,000-impression cutoff is a reporting rule of thumb, not a statistical significance threshold. We flag it because we've seen vendor reports do exactly this.
- Delivery, not demand. This flight was scoped as a mechanics test: pacing, CPMs, completion rates, two targeting approaches head-to-head. This report covers delivery and click-through performance; it does not establish lead generation, sales performance, or ROAS. More clicks do not necessarily mean more qualified prospects.
- One flight, one budget, one vertical. Thirteen days at $500 doesn't establish a curve. A second flight will give us another data point.
- We built the tool and ran the test. Self-reported numbers on self-built infrastructure. The DSP export is third-party; the interpretation isn't.
The point of a house campaign is that you can check the work before committing to it. What our $500 bought through Passion+: fifty-six thousand impressions, even pacing, CTV completion in the high nineties, and reporting detailed enough to identify your worst-performing line. Ours was an audience type we'd been treating as a default.
The Wizard builds the plan from a few questions about your brand and launches it from $500, no retainer. If you want to see it with your brand in it rather than ours, that's what the demo is for.
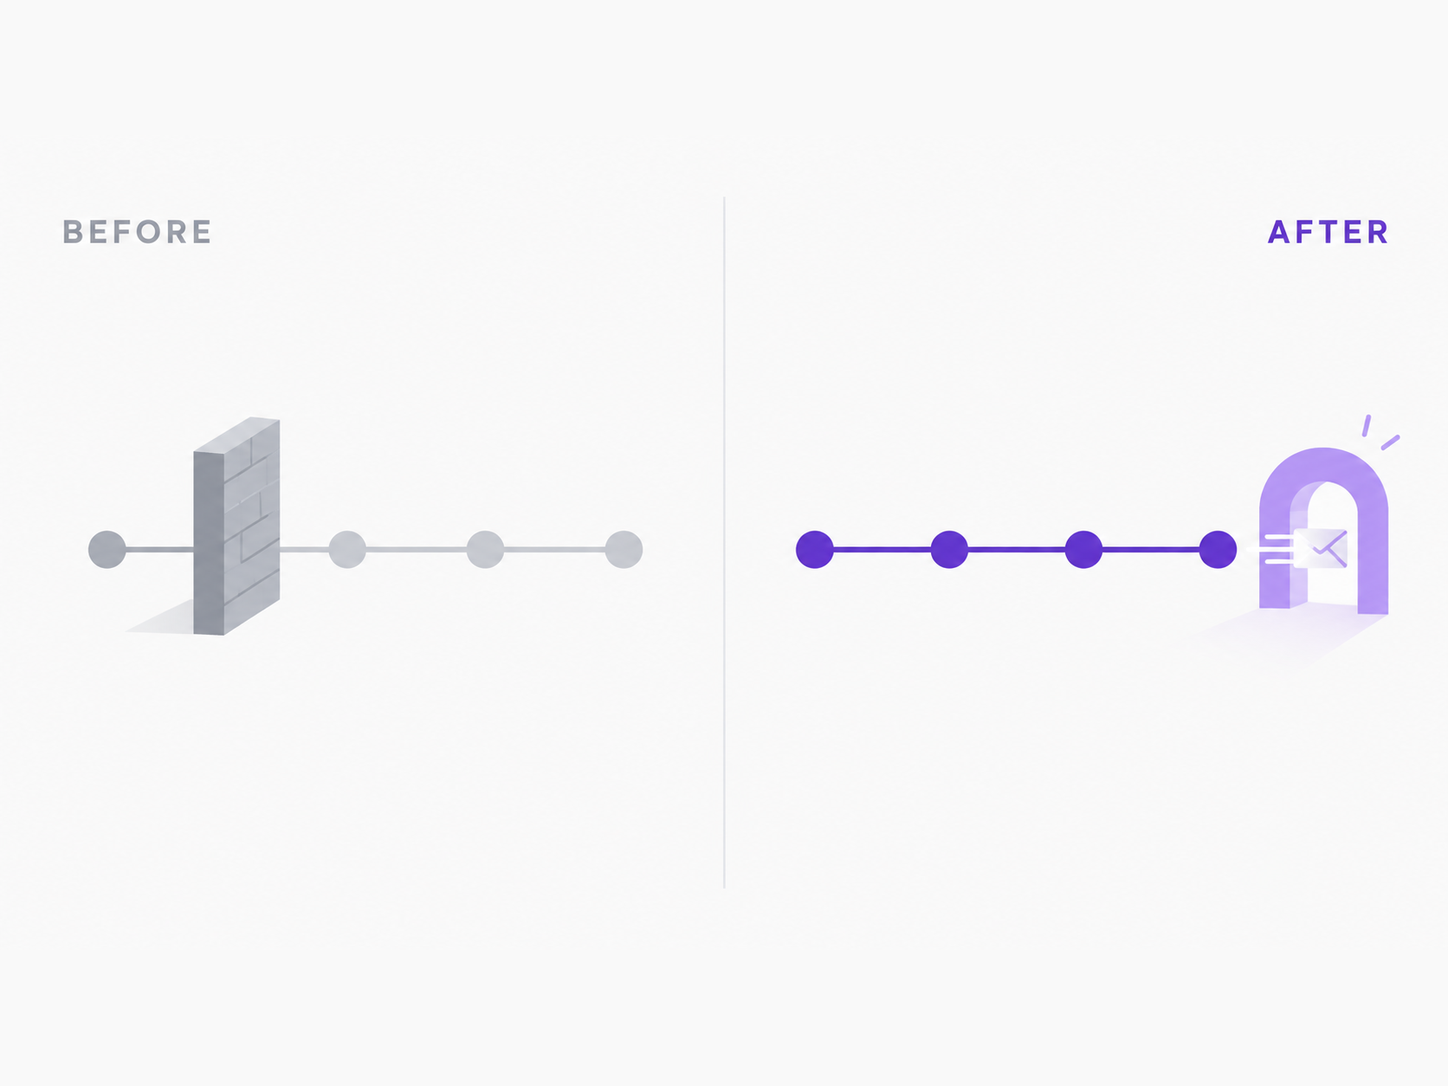
The next flight starts without the interest line; its budget moves to geofences. We'll publish those numbers too. Meanwhile: what the campaign's funnel data told us about our own landing page — and the journey rebuild it triggered.
Data source: Pontiac DSP, campaign 14699, Aug 19–31, 2026.
Frequently asked questions
- What is geofence targeting in programmatic advertising?
- Geofences define geographic boundaries. In this campaign, we used audiences built from visits to fashion industry hubs, including showrooms, market centers, and a trade-show venue. Audience membership reflects a location visit; it does not mean an ad was served while someone was still inside that boundary.
- How did the two targeting approaches compare?
- The geofenced line delivered 0.43% CTR versus 0.07% for interest targeting, using the same creative and publisher pool over thirteen days. It accounted for 134 of the campaign’s 141 clicks. We’re moving the interest line’s budget into geofence prospecting for the next flight.
- What does $500 buy in programmatic advertising?
- In this flight: 55,978 impressions across 200+ DMAs and 800+ publisher domains at an $8.93 blended CPM, split between connected TV (26% of impressions) and display/mobile, delivered evenly over thirteen days. That is what the [Fashion Wizard](/fashion) builds plans around: test-sized budgets with real delivery.
- What can a $500 test tell a brand?
- This flight shows how the budget paced, what impressions cost, and how two audiences compared on click-through rate. Those results gave us a concrete budget change to make in the next buy.